Home Sensing Primer Glossary Physics Related Technologies Acknowledgements
Spectral Coverage and Resolution
The range of wavelengths at which a sensor is sensitive is called its bandwidth. For example, the film used to record the figures on the
previous page was sensitive to visible photons (i.e. a wavelength range of about 0.4 through 0.8 microns), but was insensitive to
other forms of radiation
such as ultraviolet or infrared radiation. As such, the bandwidth was 0.4 microns (0.8-0.4=0.4). If an instrument can
detect radiation in more than one wavelength range, each wavelength range is referred to as a different band which the instrument builders
may refer to by unoriginal names as "band 1", "band 2", etc.
Color images are more complicated than black and white images. To produce a good color image, you need at least three
separate images, each taken at a different band. The figure below shows how the information in the visible spectrum might be sampled.
The black line at the top of the figure indicates the bandwidth over which the detector is sensitive--in this case from deep blue to dark red.
If a filter that passes only green wavelengths (such as illustrated by the sensitivity curve at the bottom central portion of the figure)
is inserted into the instrument, only green wavelengths will be detected. Similarly red and blue filters will produce images measuring the
red and blue wavelengths. Notice in this example that the bandwidth for the red band is limited on one side by the red filter, but on the
other side by the sensitivity of the detector itself. (This is also the case for the blue band.)
Three bands being used to span optical wavelengths.
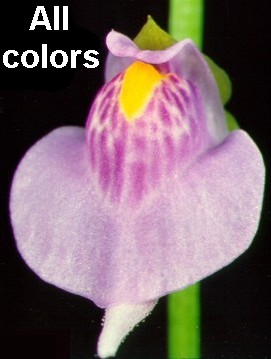
For a more concrete example, you might take three pictures of a flower (Utricularia calycifida) at red, green, and blue bands, as in the figure below (in this case, the images could be obtained using black and white film, and three filters).
These three images can be combined either in the darkroom or on a computer to make a lovely color image below. This works only if the three images are very carefully co-aligned (or registered) properly. (This can be complicated and difficult to do for remote sensing images--the data from the various bands must be correctly oriented and scaled, and several technical factors conspire to make this step challenging.) It is worthwhile to look at the color image below and the three black and white images above that were used to make it. Note how the images at different bands highlight different features of the flower. The blue band emphasizes the contrast in the yellow spot on the corolla. The green band brings out the reticulation in the palate bulge. This sort of thing is getting close to the essence of remote sensing.
Notice that in creating the color image above, you need three photographs. That means three times more data is
needed for color images than is needed for black and white photographs. Remote sensing may be done with even more than three bands in the
image, as you will see when we discuss multispectral and hyperspectral remote sensing, on the next page.
You may observe from the diagram of the three bands at the top of this page that not all
of the color spectrum is being sampled equally--the yellowish-green part of the spectrum lies neatly between the green and red filters,
where the filters are not very sensitive (there is a similar but smaller gap between the blue and green bands). This lack of complete
spectral covereage is not necessarily a problem. In fact, using only a very small part of a band is often a clever remote sensing
strategy! Consider the figure below:
Underneath the reference continuum spectrum I have drawn a black squiggly line that indicates a spectrum that we
would like to measure. Observe that it has a one deep absorption feature at blue-green wavelengths and another at
orange wavelengths. In order to monitor the these two spectral features, three narrow-band filters at the wavelengths shown by the blue
curves in would be excellent choices. With this set of filters, neither the blue portion nor the far red portion of the spectrum is
being measured, but who cares? The interesting spectral behavior is elsewhere.
Do you understand how very narrow bandwidth filters can be appropriate if a spectral feature of interest is also narrow?
When scientists make poster papers on their exciting remote sensing work, you can bet they will want to combine various
images to make a neat color image, much like the three black and white flower images above were combined to make the pretty color image.
They can do this using a printer with blue, green, and red inks even if the
three bands do not correspond to blue, green, and red bands. They do this by simply calling the short wavelength data "blue,"
the intermediate wavelength data "green," and the long wavelength data "red." The resulting image is colorful, but
since it does not faithfully reproduce how the object might appear to human eyes, it is called a "color composite image." While
color composite images (and false color images) are often just used as flash to attract the eye to poster papers at conference, they can
be much more than that; they can immediately highlight important features that would not be visible without the fancy image processing
that went into their construction.
There is one
technical detail on bandwidths that I feel compelled to mention. The bandwidth is usually defined as including the
wavelengths at which the sensitivity of the detectors is greater than 1/2 the peak sensitivity. The detector may actually detect wavelengths
well outside of the stated bandwidth, but only with a very low efficiency.
Also, as a disclaimer to avoid being sent e-mail corrections: I am fully aware that color addition of light
is different from color addition with inks, and that describing the production of color composite images as involving red, blue, and green
inks is an oversimplification. But this issue is not important for our discussion.